Select Your Location
Please select your location
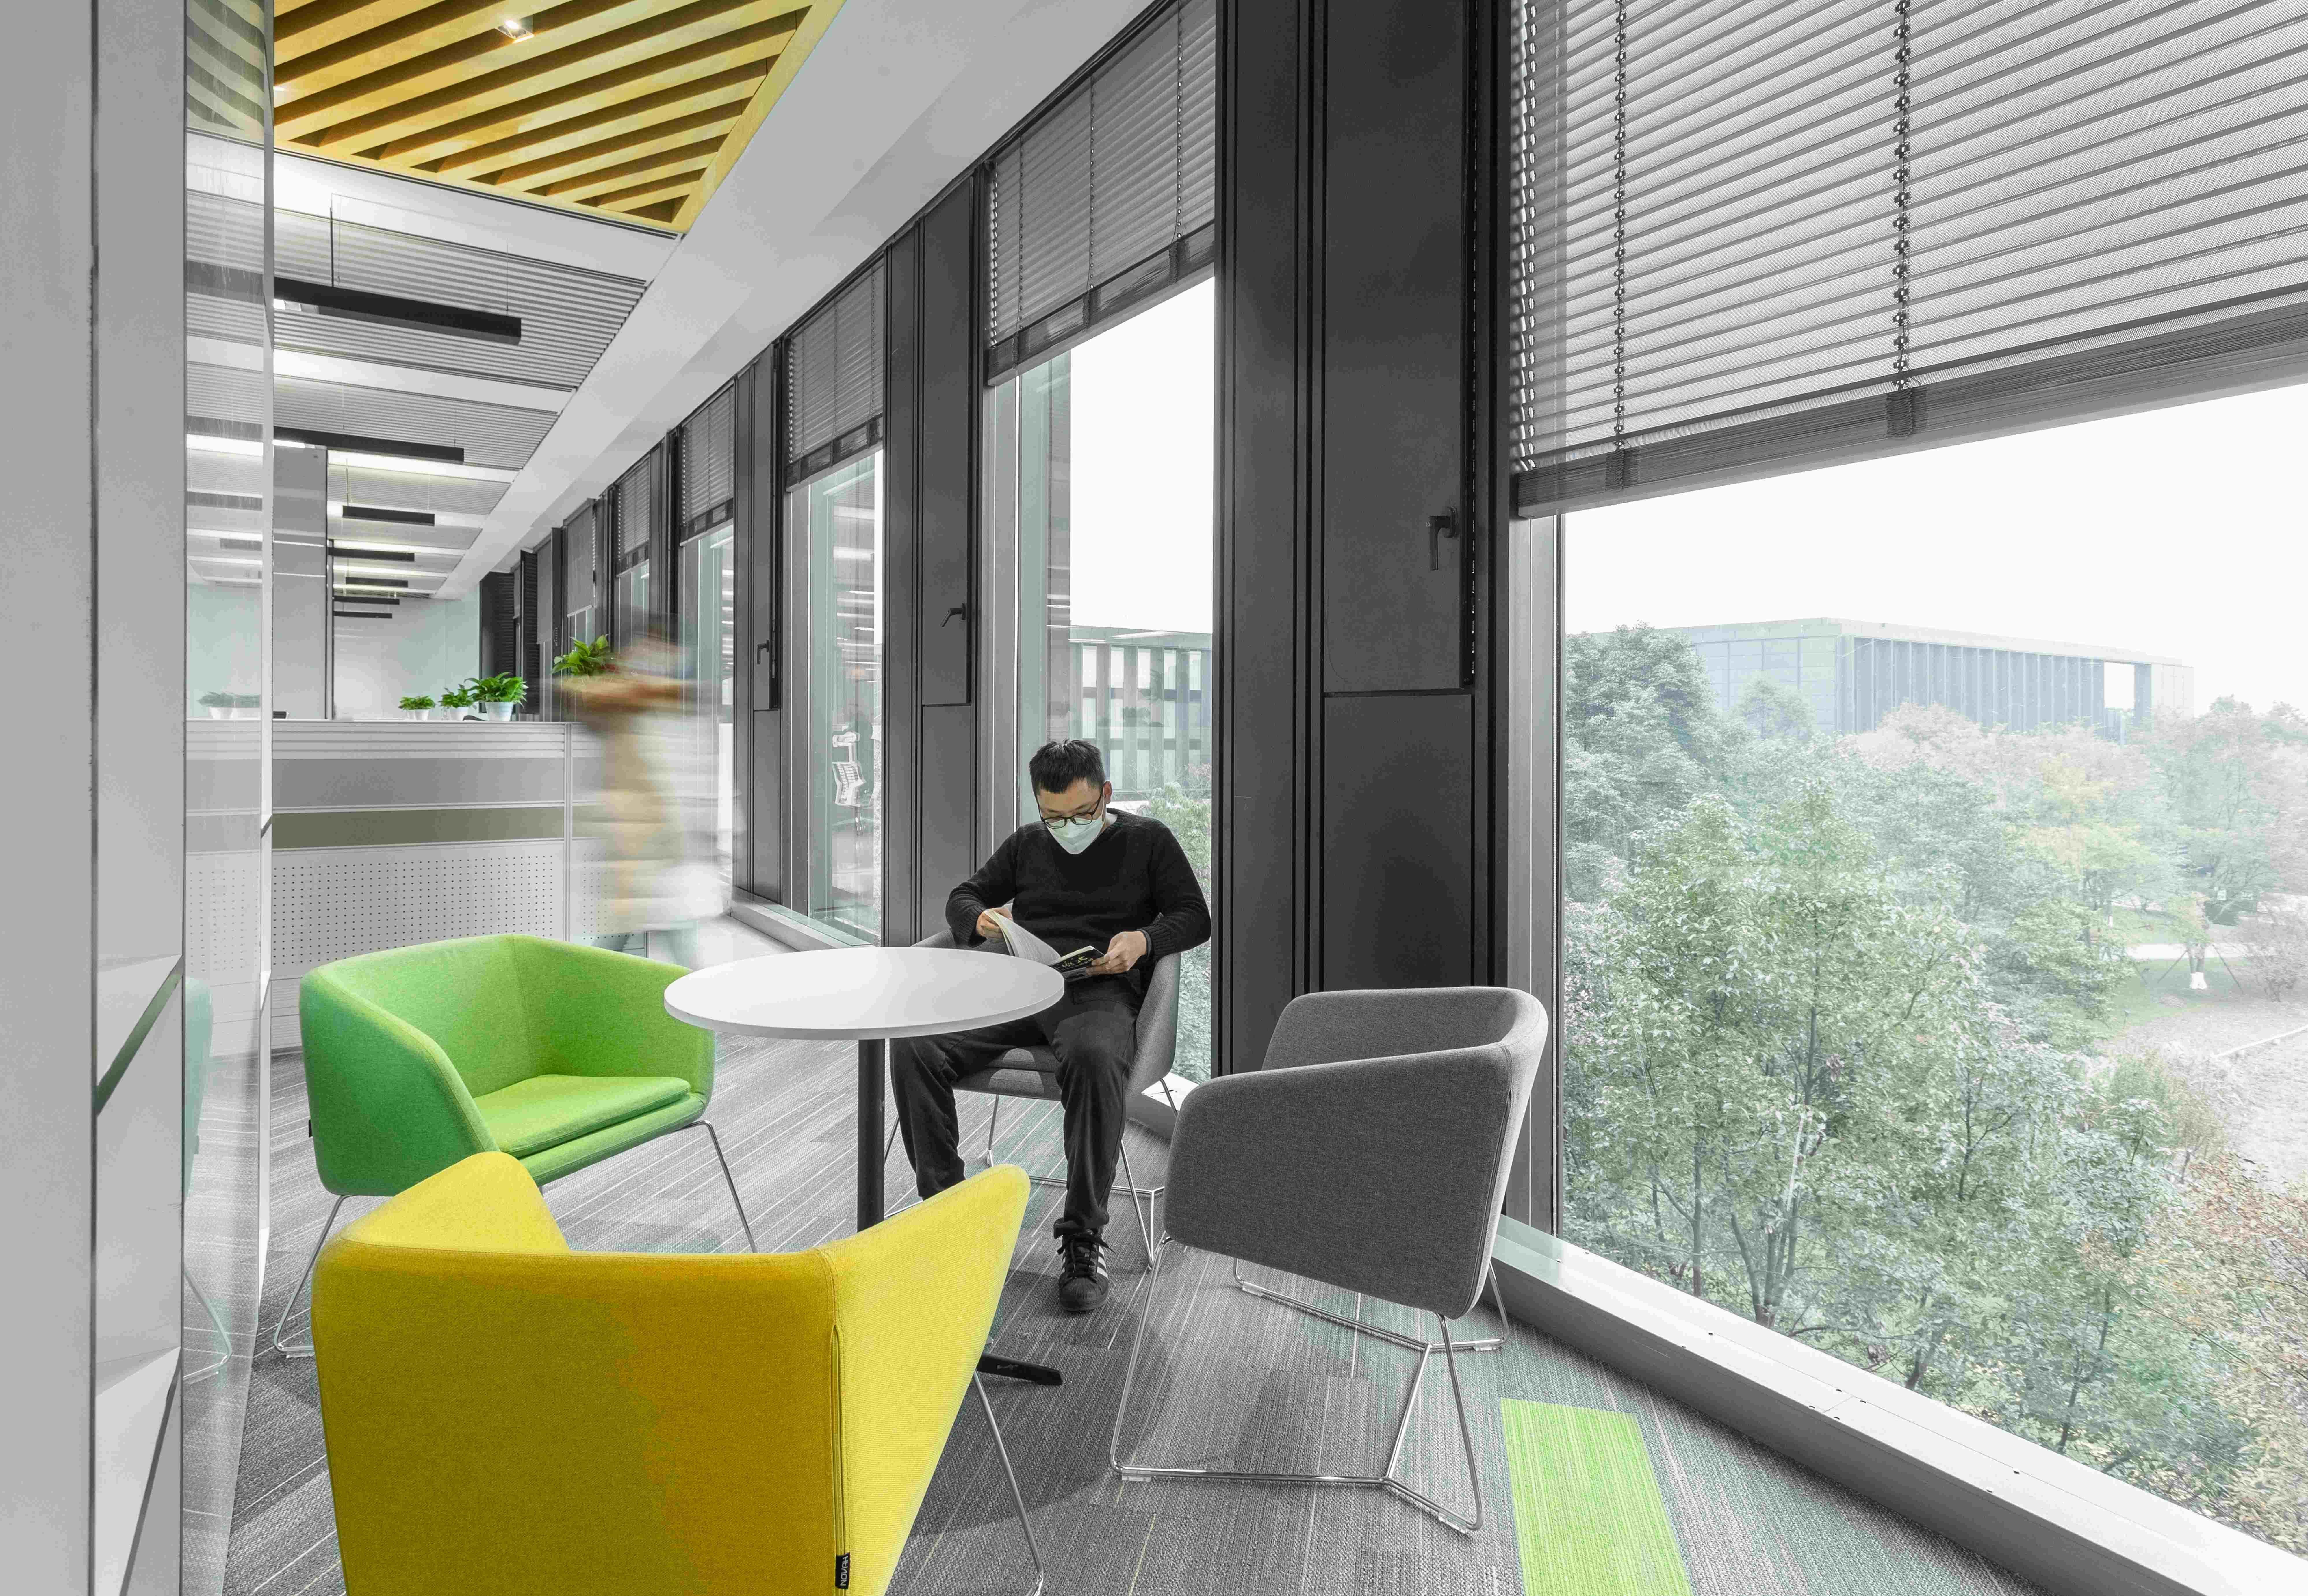
"Data is the new oil." In the era of big data, what kind of spectacular scene will appear when massive amounts of changing data appear in front of us? While digital quantification processes have been launched in various fields, office space has also undergone dramatic changes due to ‘digitalization’.
Combining the NEXT Space strategy, we have sorted out the history of office space into an exclusive SPI database. Its generation can not only provide reference and inspiration for enterprises, but also provides strong data support for enterprises to understand the future. In this issue, we will bring you an analysis of space data in the Internet industry.
Analysis of Space Data in the Internet Industry
SPI @ Internet Industry
01 Current Status of Space Proportion
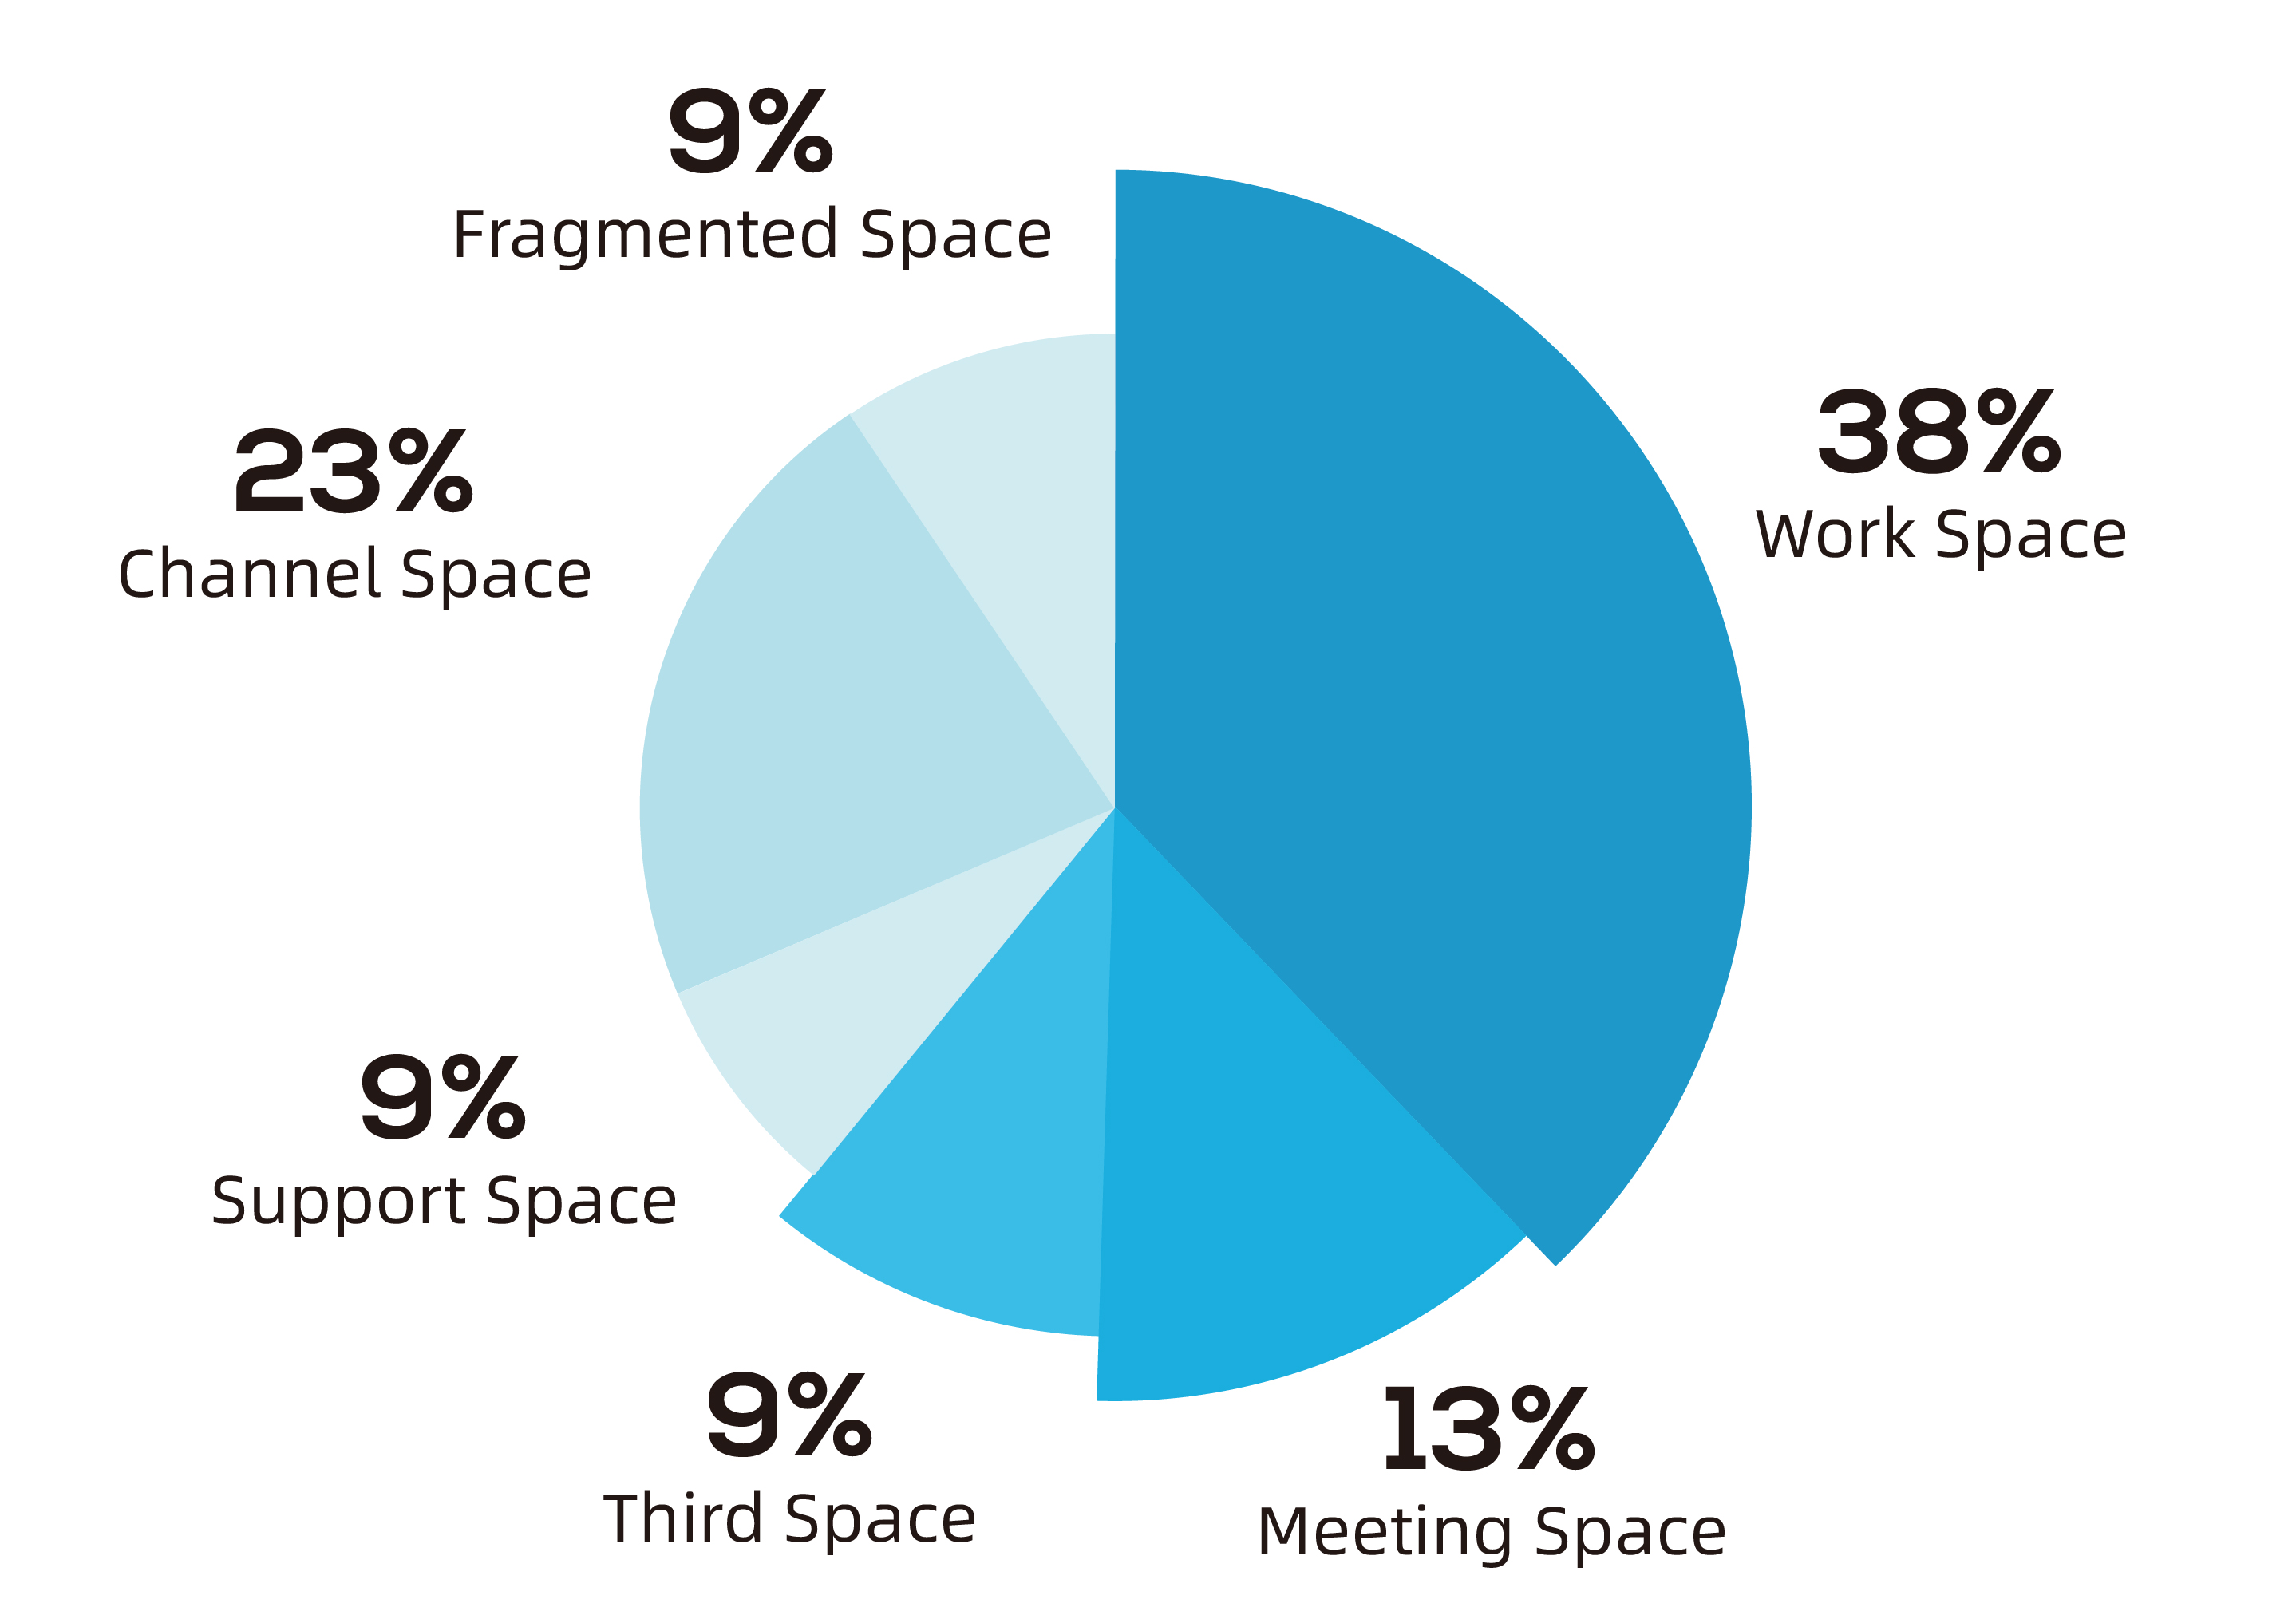
The proportion of ‘office space’, ‘meeting space’, and ‘third space’ on the Internet industry accounts for more than 60%. With the rise of new forms of office such as community-based offices, mobile offices, and cloud offices, the proportion of these three areas is increasing year by year.
02 Per capita area&seating ratio
Average area per person (㎡/Pax):
8.7㎡
According to the average area per person index in the Internet industry, we can know that employees’ workspaces are more compact. However, this does not mean that the office space is crowded, but rather due to frequent interpersonal cooperation among employees and less privacy of business.
Number of seats per person (Seat/Pax):
18
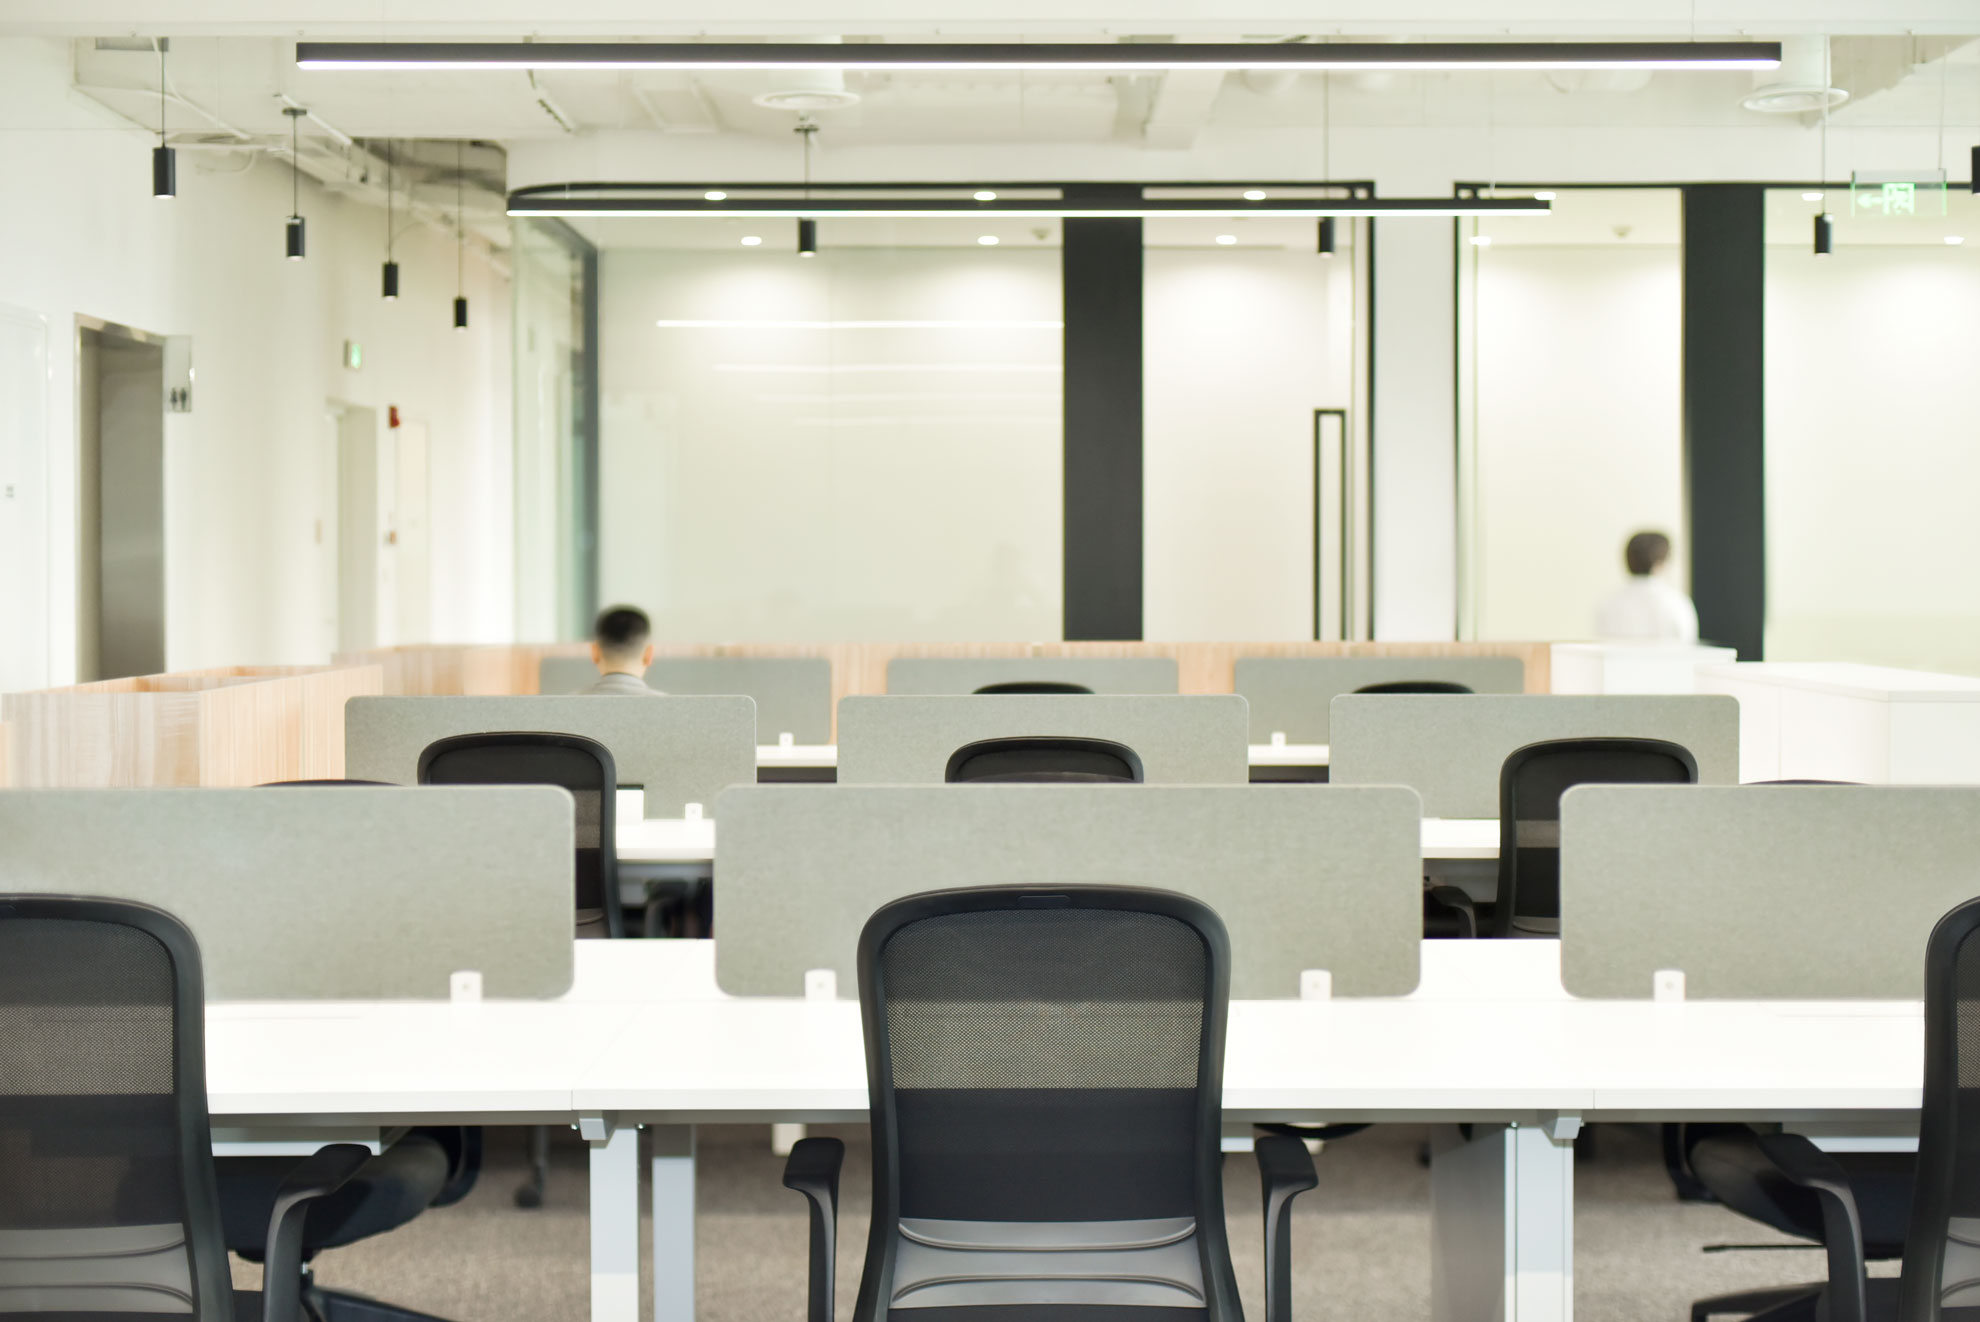
Business expansion is rapid, and the number of employees is growing rapidly, so personal workstation resources are the primary necessity. Workstations are productivity, and most work is carried out directly at the workstation.
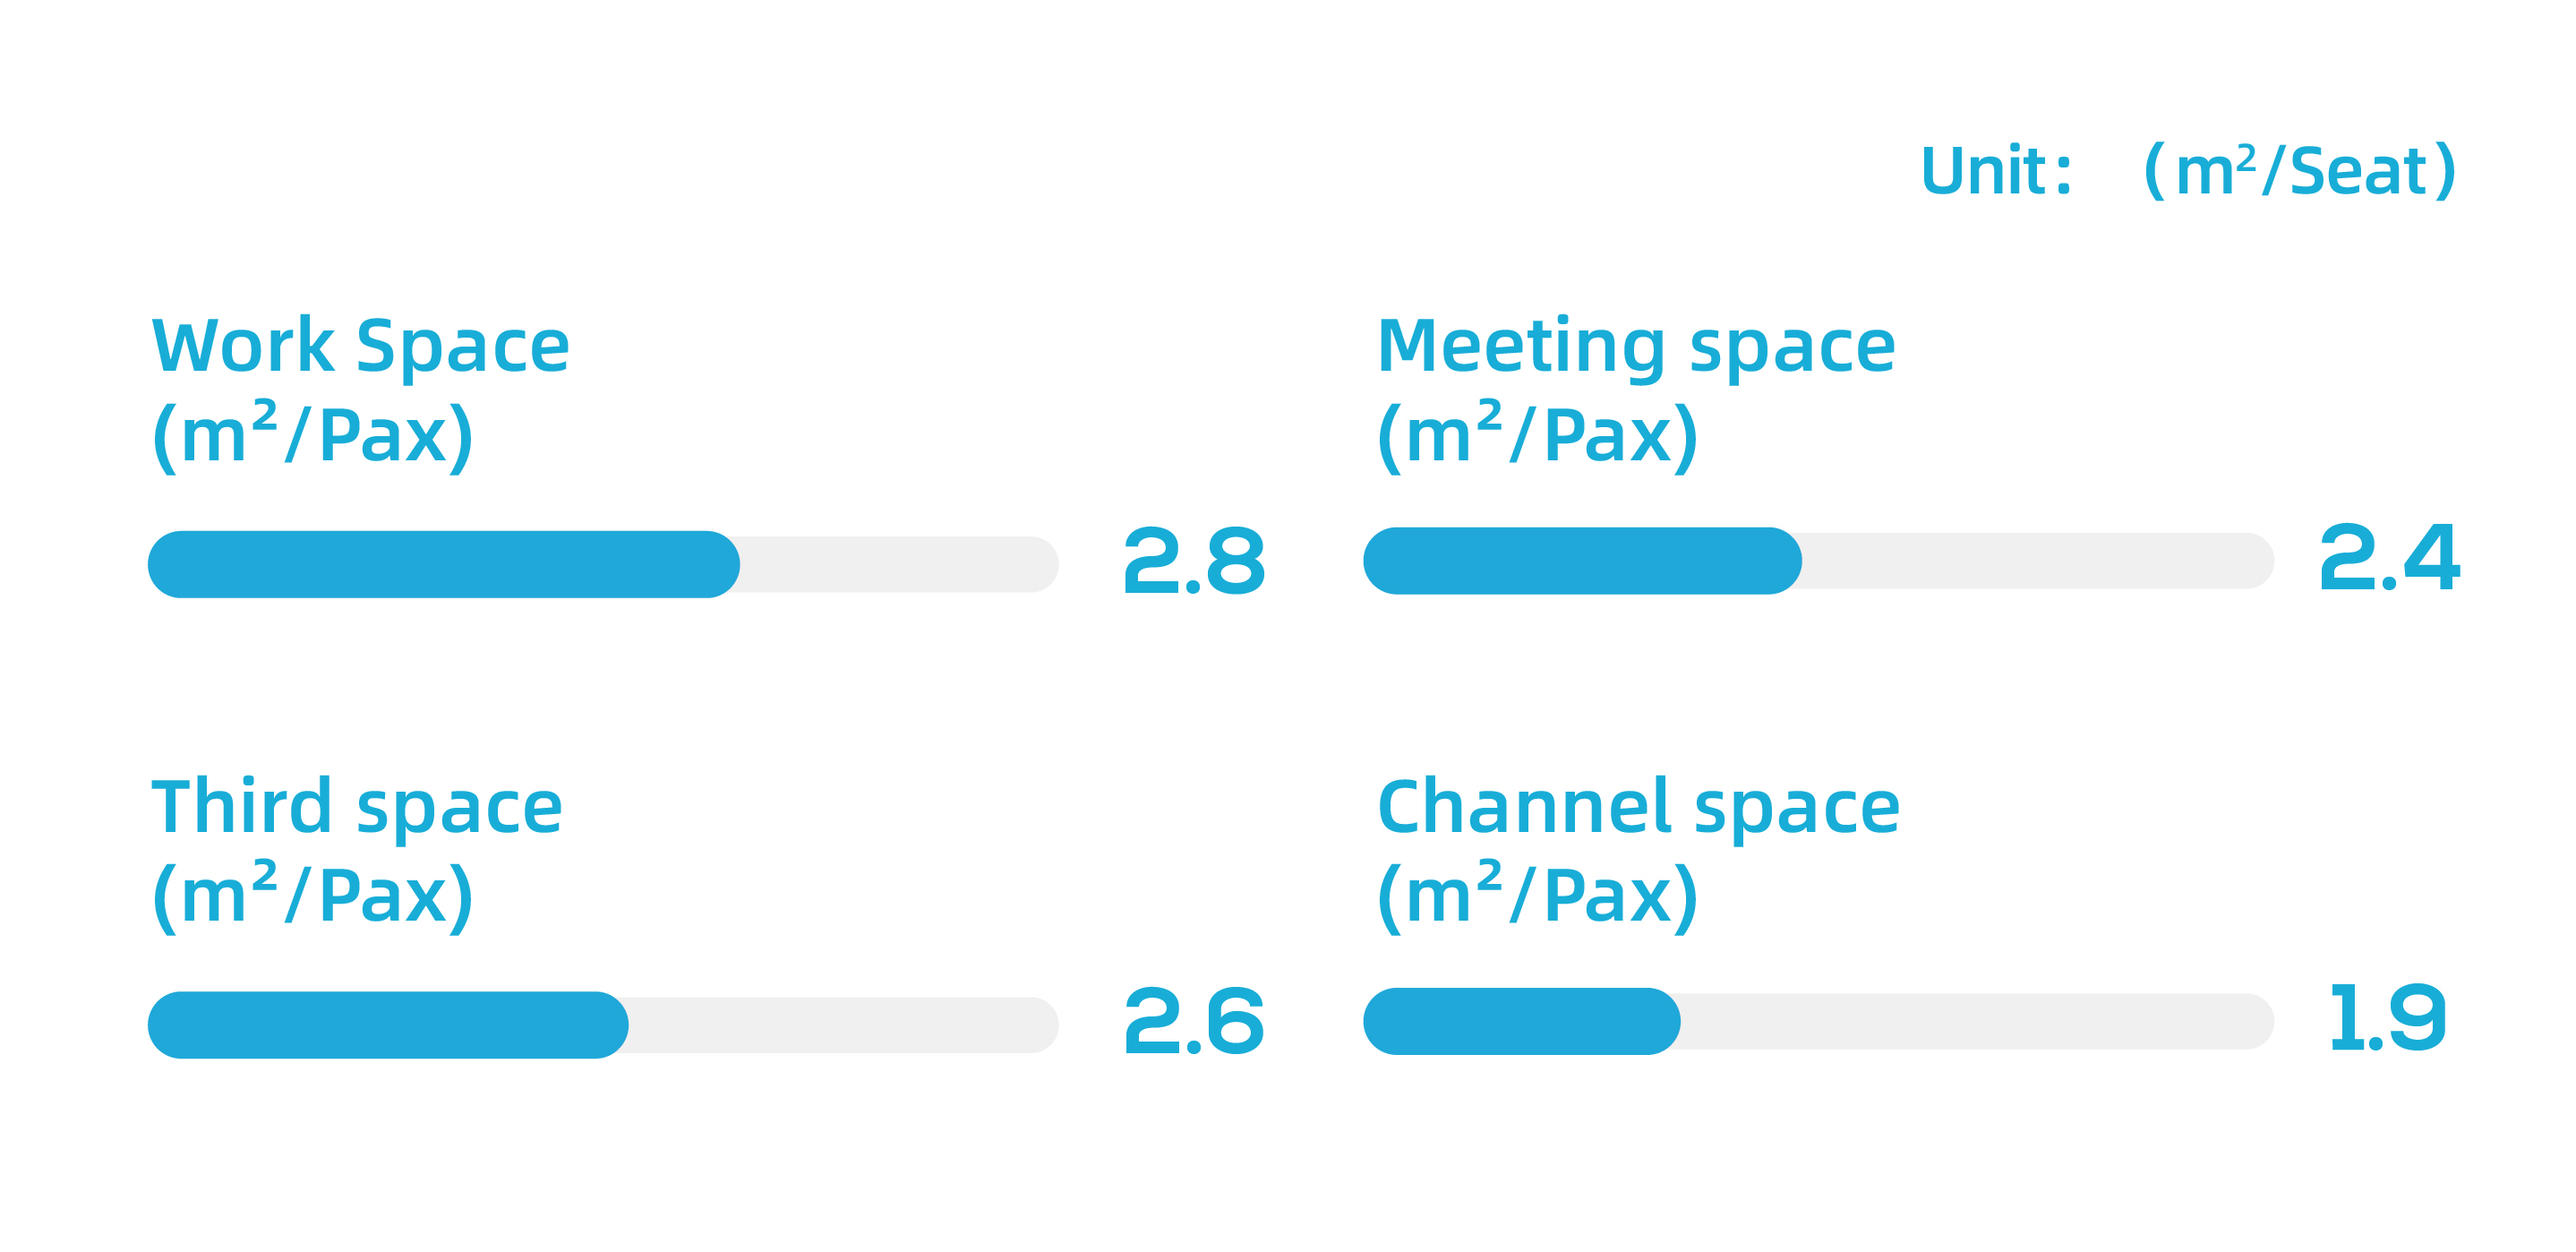
03 Space tolerance
Four tolerance indexes of Internet industry, which directly reflect the reasonable comfort level of each space.
04 Share of communication resources
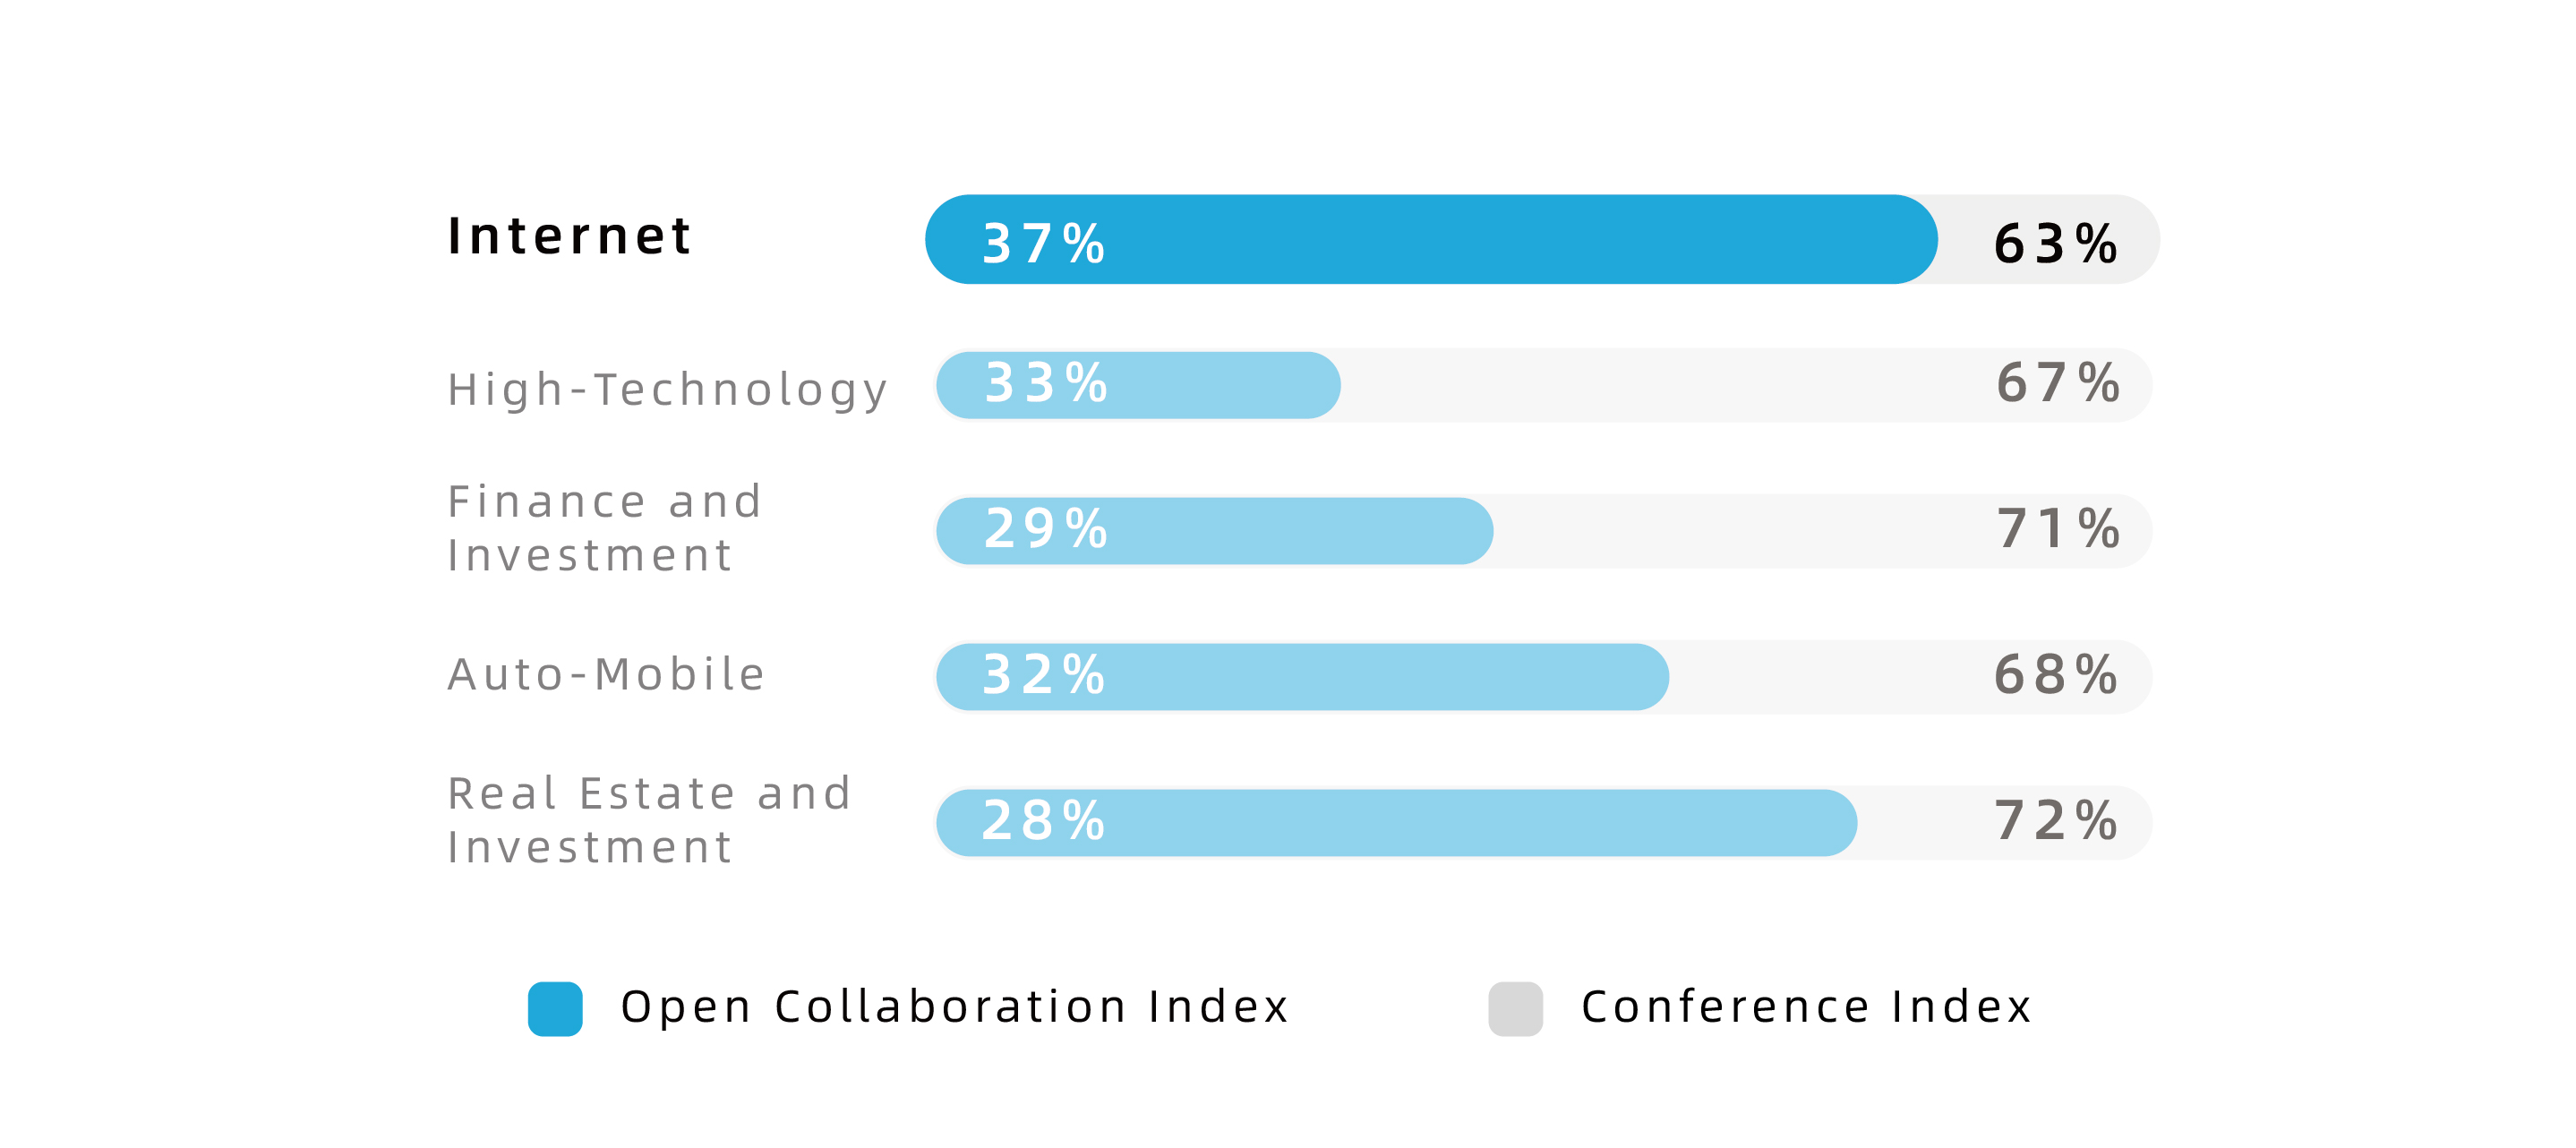
The communication index includes meeting and collaboration indices. Among them, the proportion of collaborative index in the Internet industry is the highest, which shows that Internet employees prefer open and collaborative communication methods.
05 Other Resources Index
The index of other resources in office spaces can reflect the industry’s usage preferences in different scenarios.
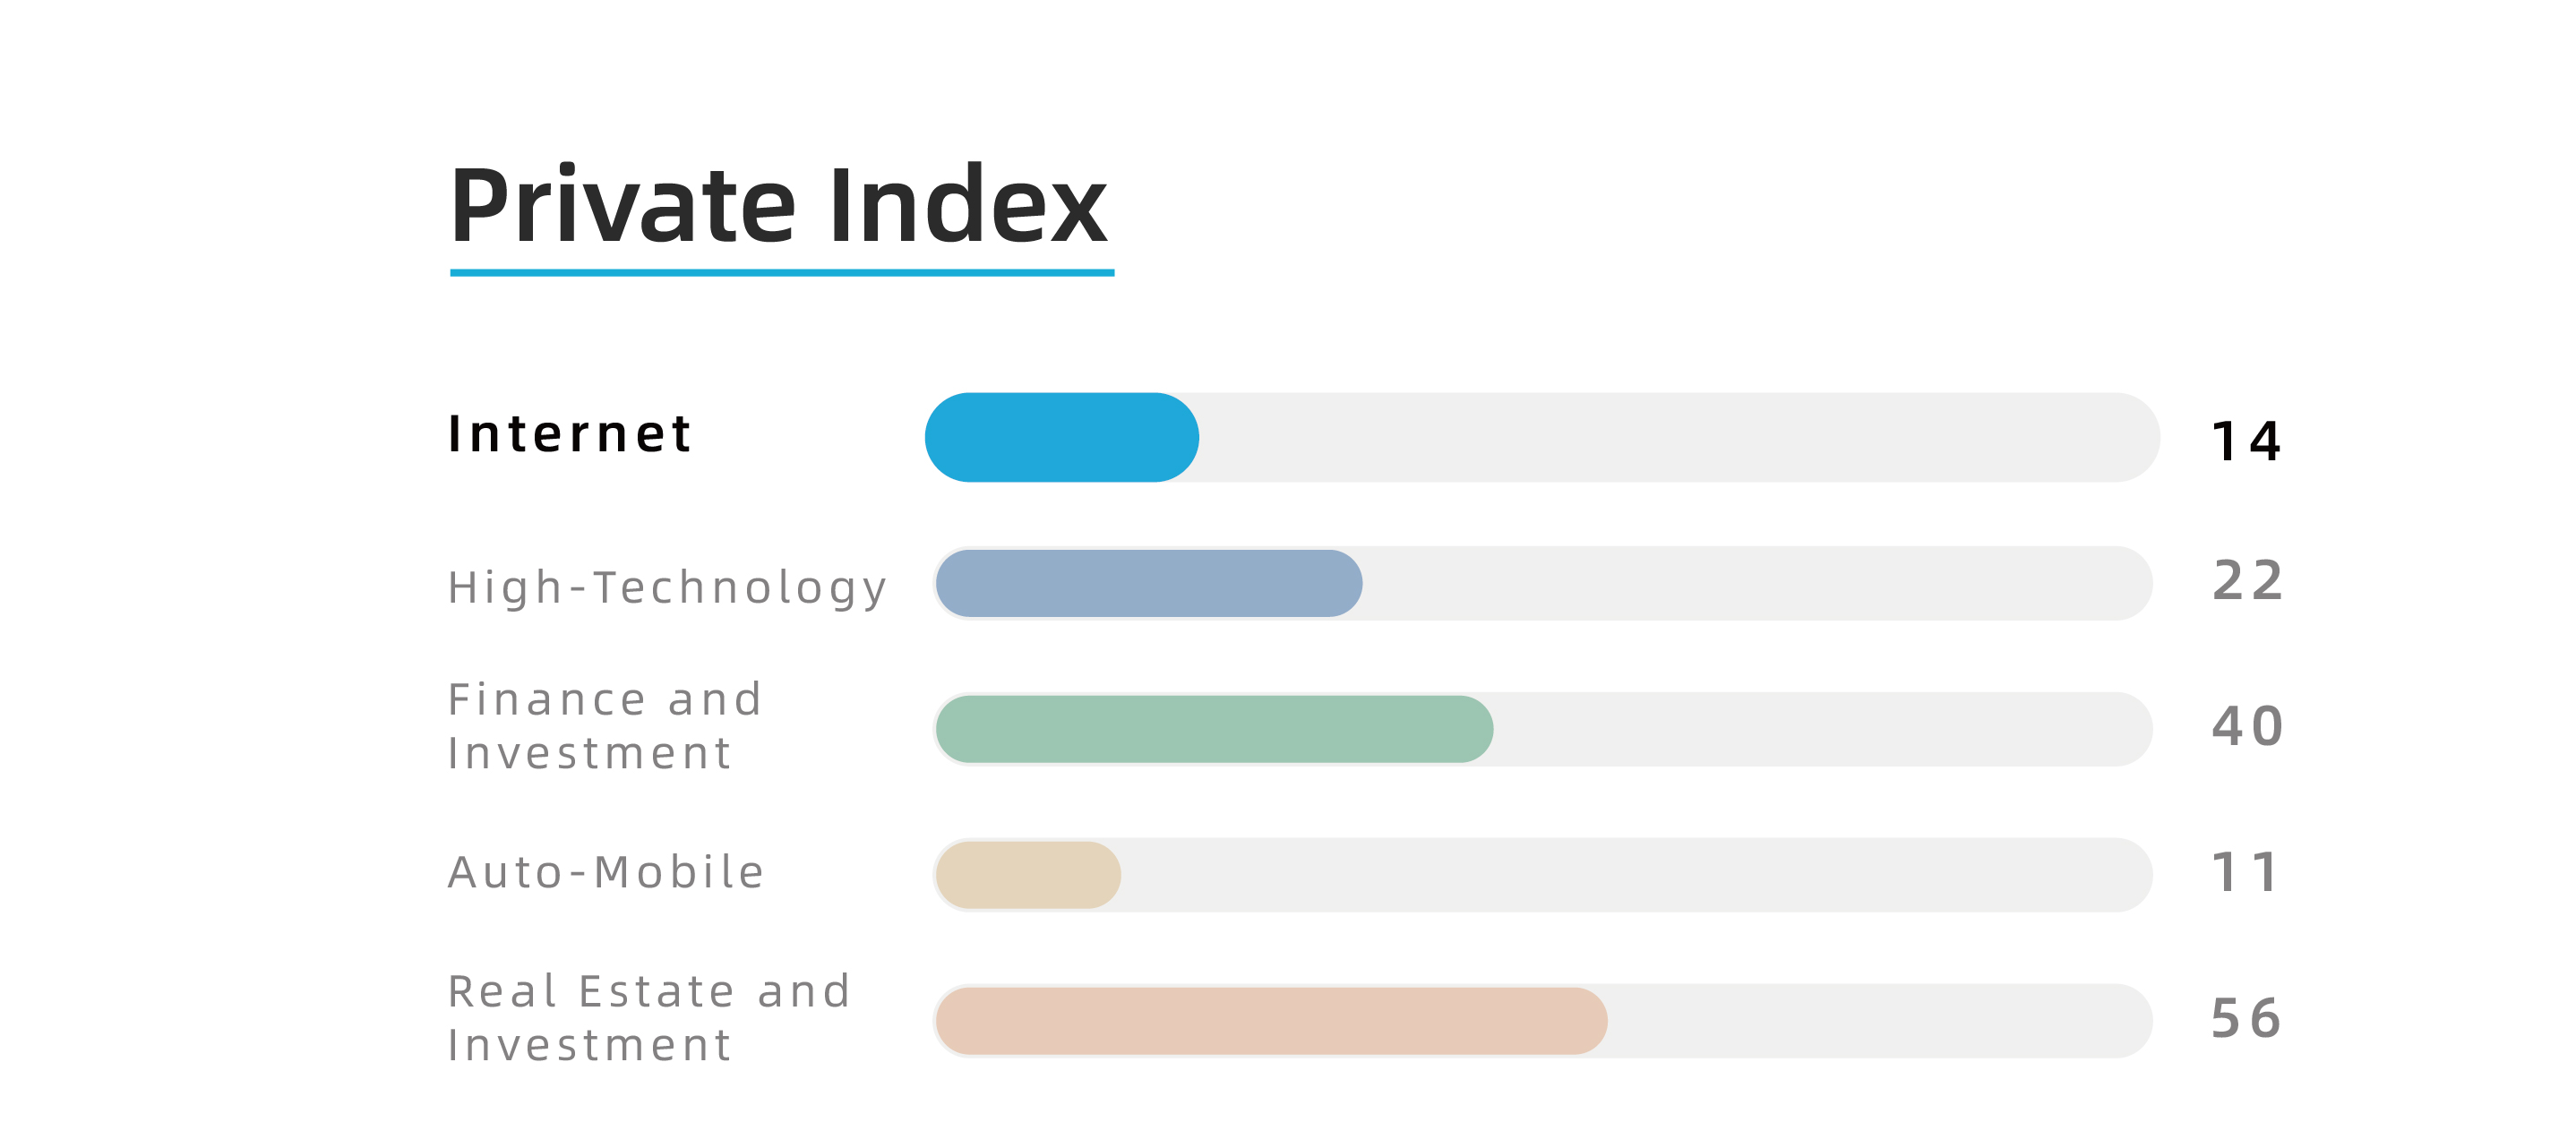
In the Internet industry, companies tend to advocate openness and flexibility, embrace change, and have less demand for privacy.
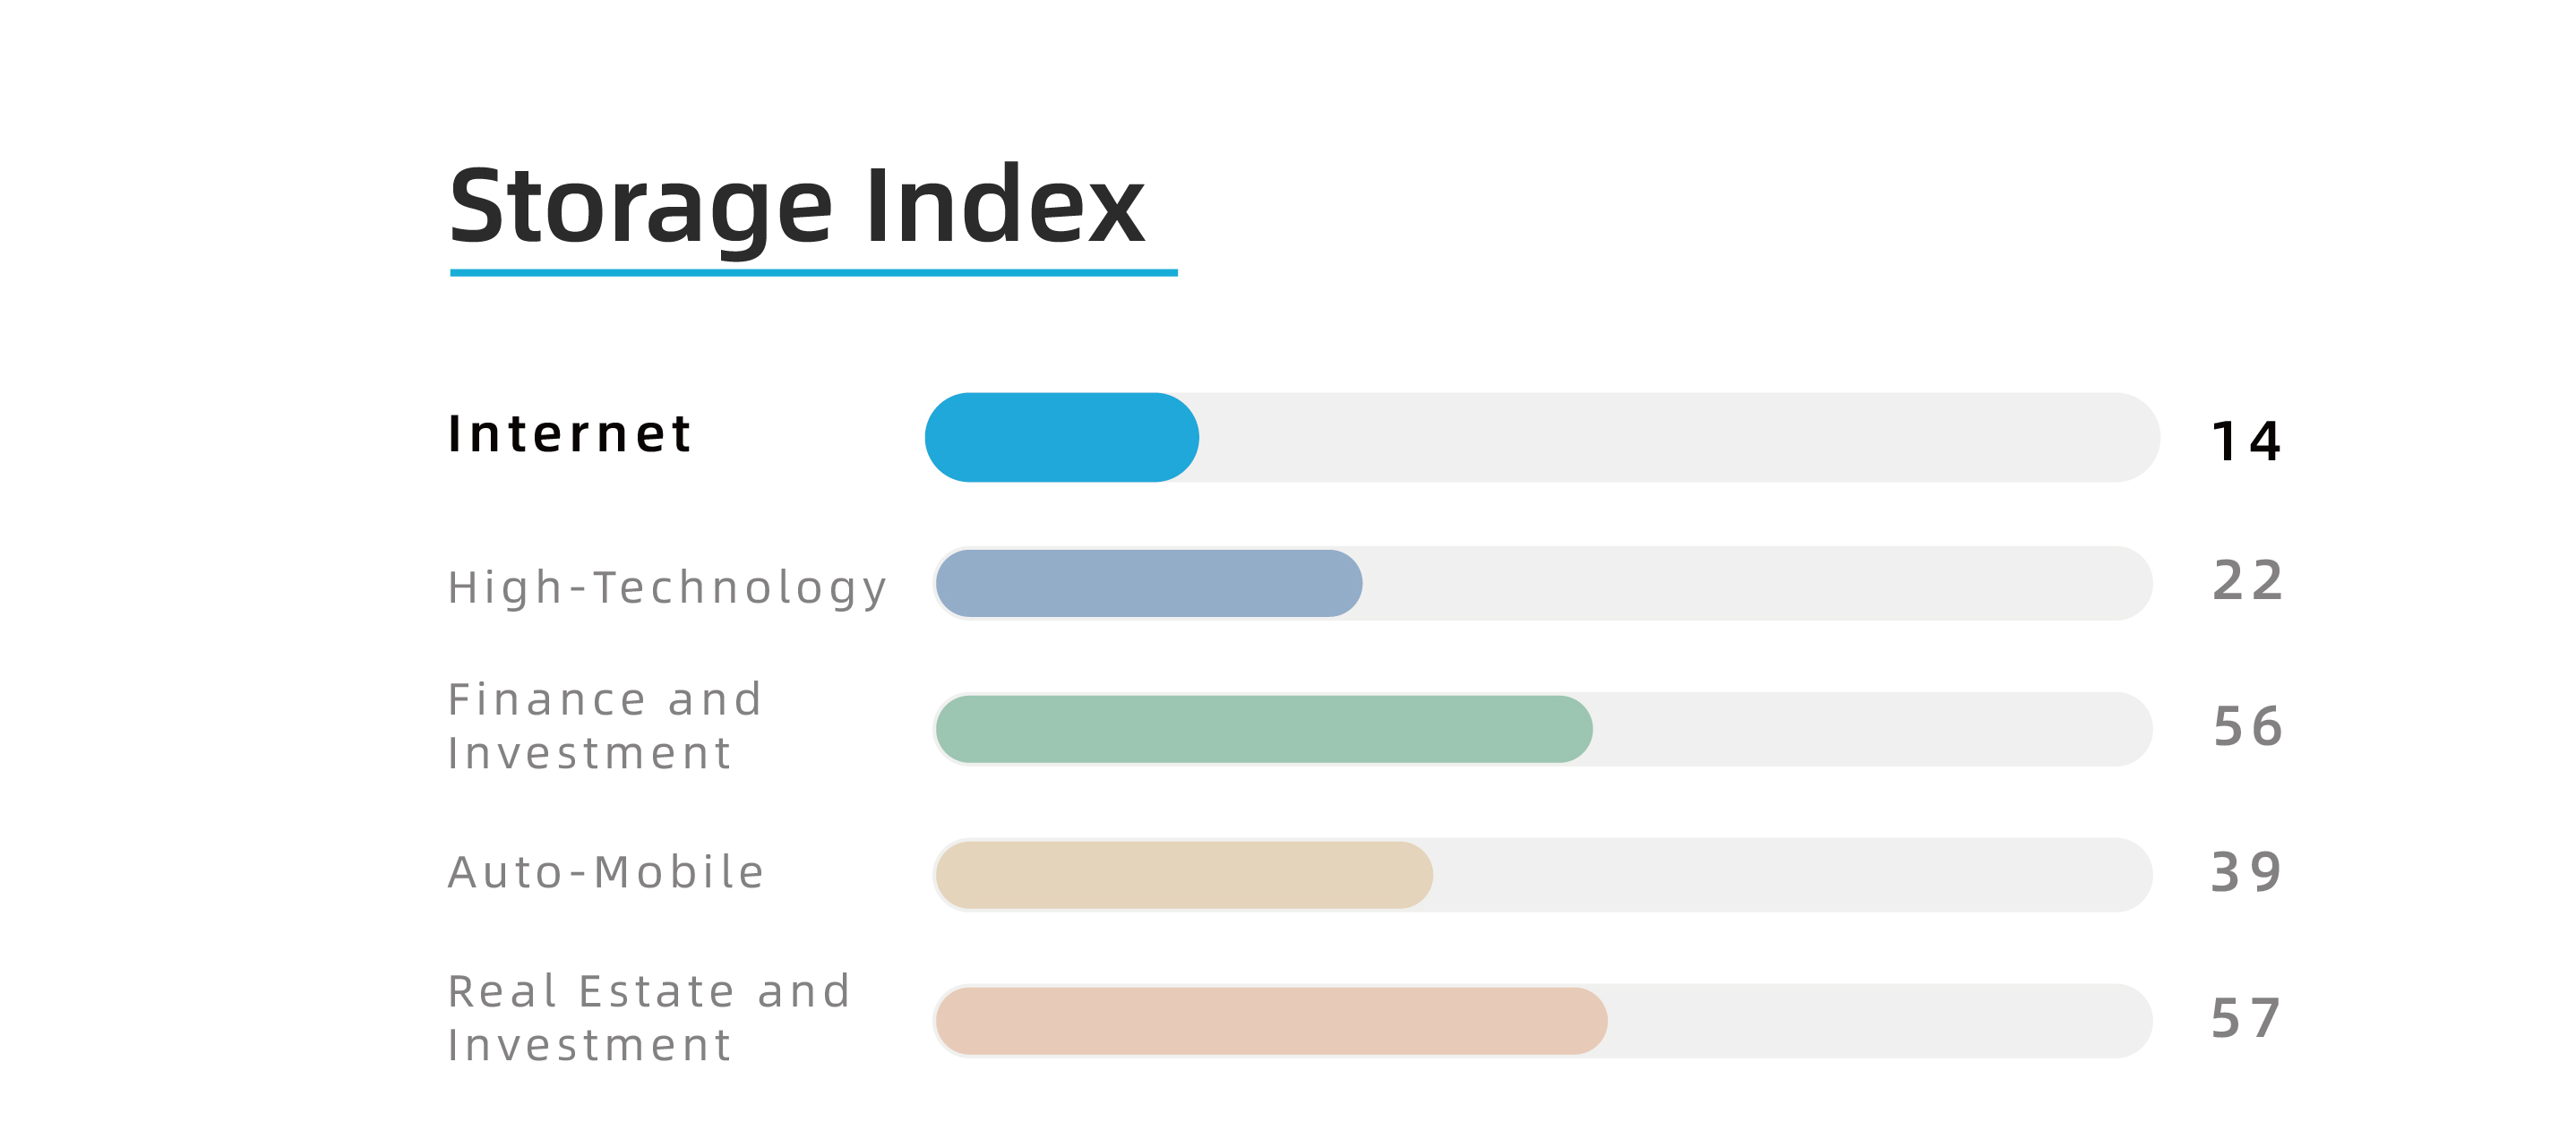
The storage coefficient is the lowest in the top five industries. This is because intelligent means replace physical materials, reducing storage needs to a minimum.
What should be noted in the spatial planning of the Internet industry in the future: Insights on Future Spaces?

01 New demands + new models = new dynamic balance
With the rise of online office and remote collaboration, there will be a new dynamic balance in Internet office space;
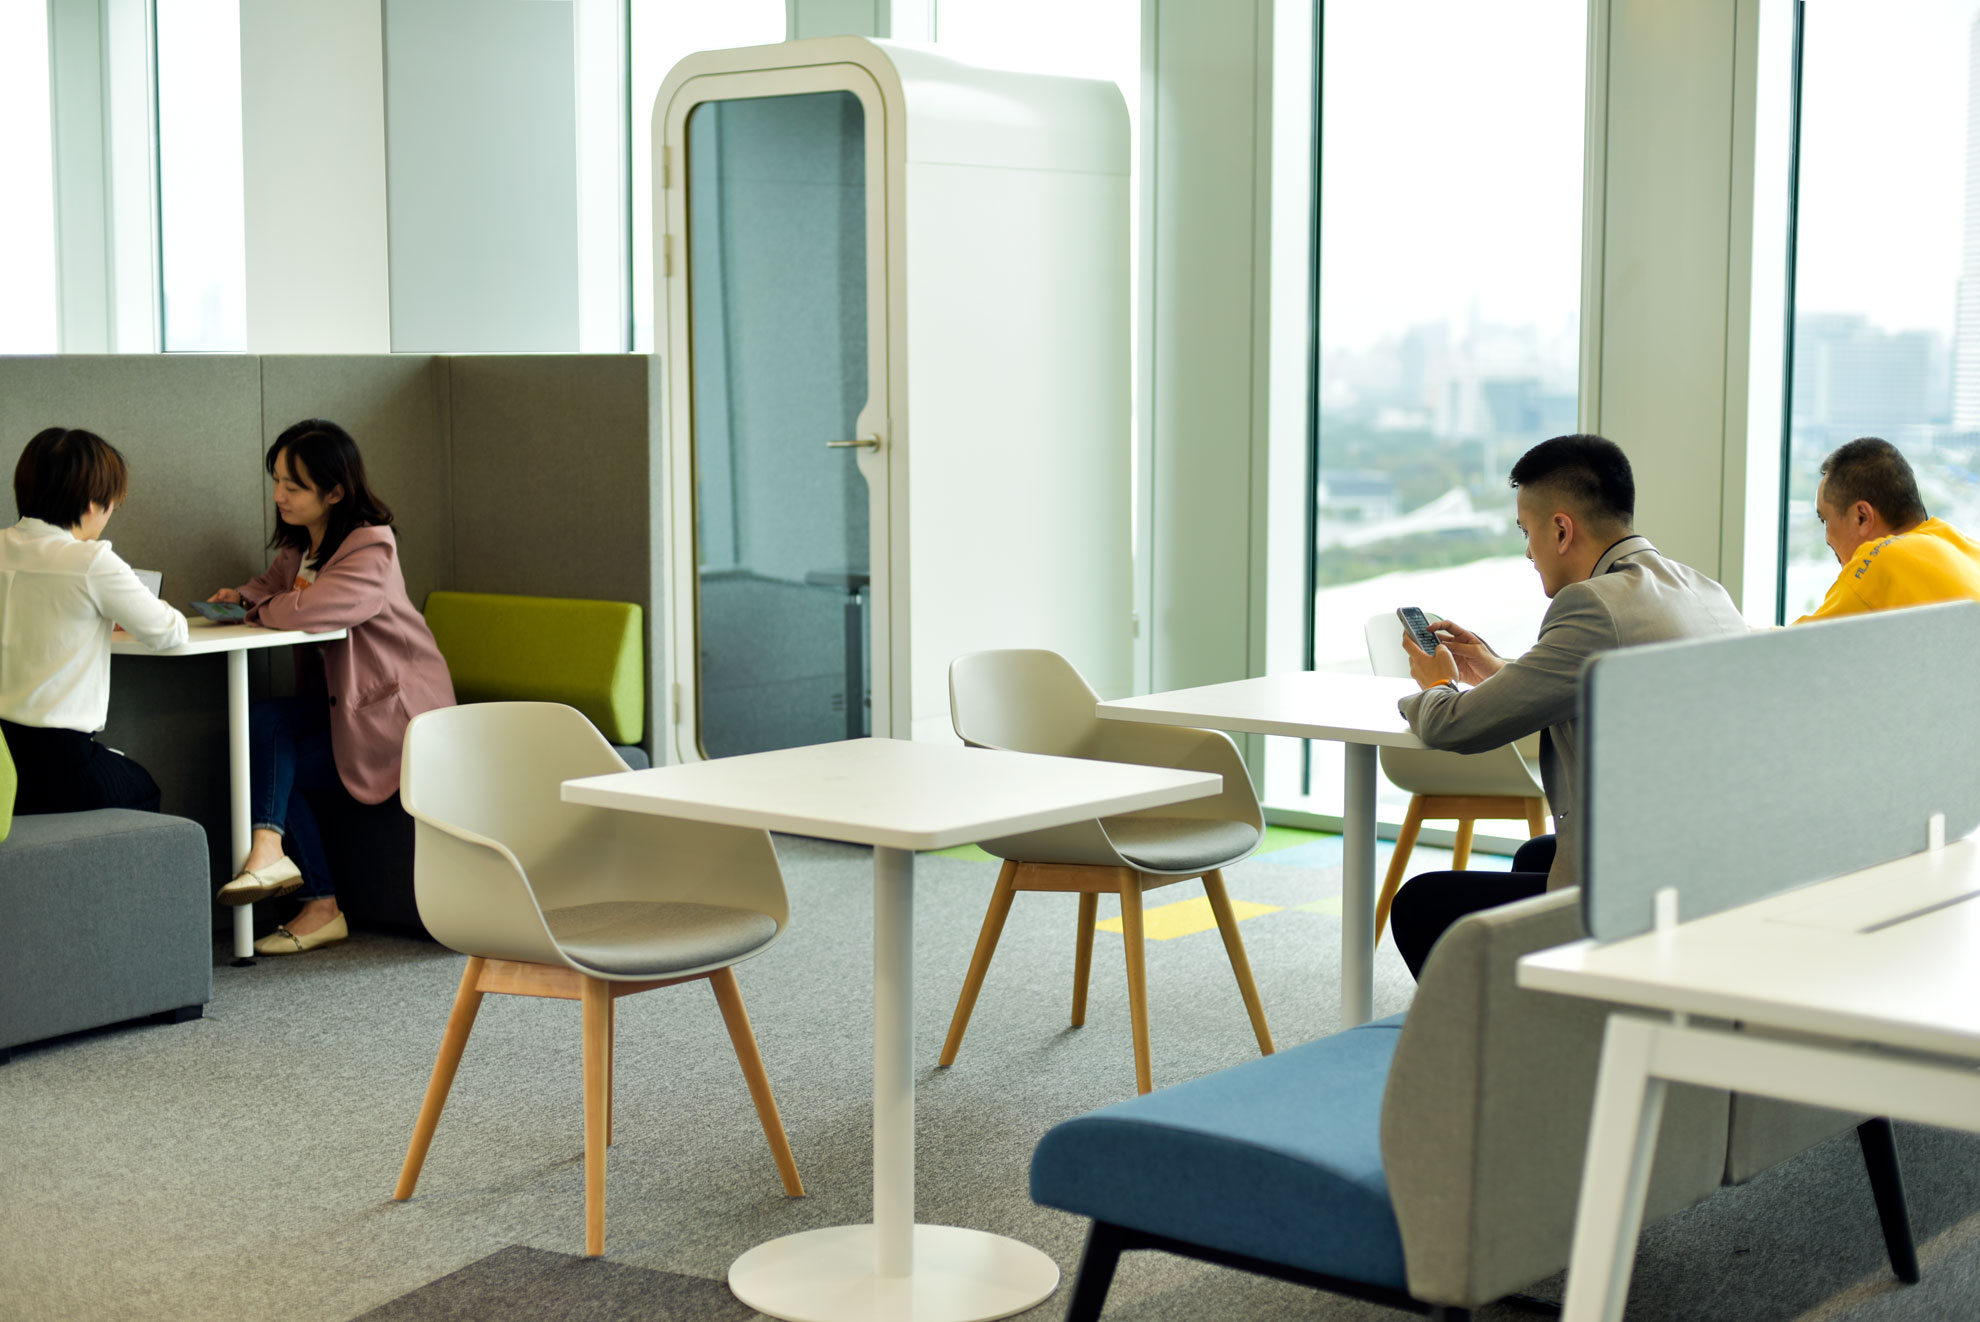
02 Establish ‘community-based’ office space
This space can change and expand multiple functions, compatible with diverse office scenarios;
03 Focus on the efficiency of space use
Increase spaces with high usage rates while synchronously reducing those with lower usage rates, further improving floor efficiency by making full use of fragmented spaces;
04 Provide possibilities for the transformation of office space
Through flexible reconfiguration of space furniture configuration, support the ever-changing business needs of the Internet industry.
© 2024- NOVAH. All rights reserved.